The Global Innovation Index recently released their 2017 report—its tenth edition. The result of a collaboration between Cornell University, INSEAD, and WIPO, the detailed report reviews 127 economies and their standings in various areas linked to innovation.
The report measures economies through seven categories—or pillars—of analysis.
Five Input Pillars
- Institutions
- Human Capital and Research
- Infrastructure
- Market Sophistication
- Business Sophistication
Two Output Pillars
- Knowledge and Technology Inputs
- Creative Outputs
According to The Global Innovation Index, The GII Framework is structured as follows:
“Each pillar is divided into sub-pillars and each sub-pillar is composed of individual indicators (81 in total in 2017). Sub-pillar scores are calculated as the weighted average of individual indicators; pillar scores are calculated as the weighted average of sub-pillar scores.”
The report provides a detailed breakdown of the strengths and weaknesses of each of the 127 economies with more than 30 sources used to attain the data required for the report.
This year, Switzerland ranked No.1 overall, with Sweden and the Netherlands placing at Nos. 2 and 3. The only Asian nation in the Top 10 was the country we have always seemed to envy, Singapore, who ranked at 7. China was interestingly ranked at 22.
So where does Sri Lanka stand and how did we fair amongst our South Asian peers?
South Asia Analysis
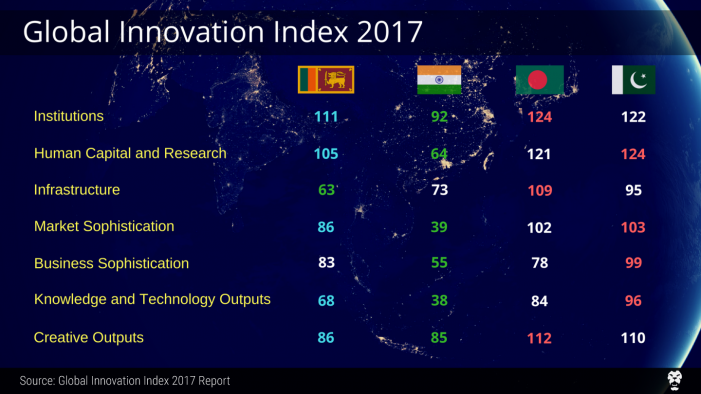
Sri Lanka ranked highest in Infrastructure with India the highest ranked in all but one category.
Light blue indicates pillars on which Sri Lanka ranked higher than Bangladesh and Pakistan but not India . Green indicates the highest ranking country whilst Red indicates the lowest ranking country in the particular pillar/category.
Sri Lanka ranked higher in all pillars against Bangladesh and Pakistan, except in Business Sophistication, where Pakistan ranked 5 places higher. However, it’s important to note that many sub-pillars under Business Sophistication was not newly reviewed, and that the ranking is based on data reported from the previous analysis. This could be a possible explanation why Sri Lanka ranked lower in this pillar.
Interestingly, Sri Lanka ranked higher than India in Infrastructure. India’s low rankings in the sub-pillar of Economic Sustainability (at 103) and the index of Environmental Performance (at 108) caused its overall lower ranking.
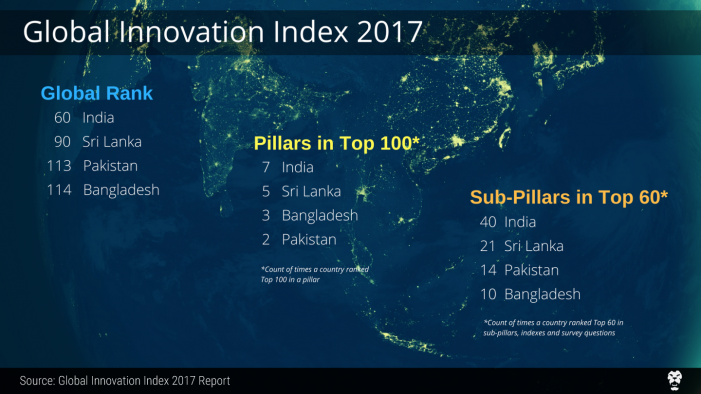
Sri Lanka ranked 60 or higher in 21 of the sub-pillars, indexes and surveys in the 2017 report.
India’s growth as a hub for IT saw its ranking soar to 8 in Knowledge and Technology outputs, while it ranked 1 in the index of ICT services export as a percentage of total trade.
Overall, none of the sub-continental nations ranked higher than 38 in any pillar, with Pakistan and Bangladesh ranking at 104 and 107, respectively, on average across all seven pillars. India’s average rank was 64 while Sri Lanka’s stood at 86.
Sri Lanka: The Positives And The Negatives
Sri Lanka ranked 90th in the Global Innovation Index report for 2017—two spots ahead of its rank in 2016. Under the primary indices, Sri Lanka ranked 94th in the Innovation Input Sub-Index and 77th in Innovation Output Sub-Index. In comparison, in 2016, Sri Lanka ranked 71st in Innovation Input Sub-Index and 115th in Innovation Output Sub-Index. Thus, while Sri Lanka has dramatically fallen 23 spots in Innovation Input, our Innovation Output Sub-Index has risen 38 spots.
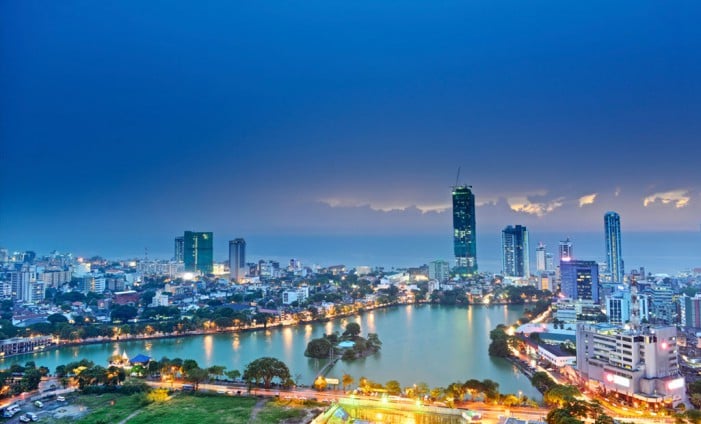
Sri Lanka rose up 2 spots in the overall ranking, but there are still some major hurdles to overcome. Image courtesy wikimedia.org
Amongst the pillars, Sri Lanka has ranked highest for Infrastructure, at 63. Our lowest ranked category was Institutions, which was placed at 111. Human Capital and Research were the only other rankings for which we were not in the Top 100.
Within Infrastructure, our highest rated category, Sri Lanka ranked 2nd in GDP/energy of unit use and 23rd in Economic Sustainability. Sri Lanka’s ICT ranked 83rd, with our ICT Access and ICT Use respectively ranked 92nd and 102nd. Interestingly, Sri Lanka’s Government Online Service and E-Participation ranked 53rd and 49th. It indicates that whilst we still have a lot to do to provide all Sri Lankans with access to ICT, our consumption of these services is very high when all things are considered.
Sri Lanka ranked well in Knowledge and Technology Outputs, stacking up as the 68th. Our strength in this area was our Growth Rate of PPP$ GDP/Worker, (which indicates how much a worker’s purchasing power is without taking into account the hours work or unemployment), ranked 11th. Computer Software Spending and ICT Services exports ranked at 33rd and 19th respectively. Say what you will of our Software Spending ranking, but it does indicate that Sri Lankans spend efficiently and that we are growing into a hub for global ICT services.
Our low ranking in Institutions is primarily a result of us being ranked 125th in the sub-pillar of Regulatory Environment, an issue that was raised because of our inefficient methods of importing tech. Our Ease of Paying Taxes was also cited as a weak point under the sub-pillar of Business environment, where it was ranked 110th globally.
Amongst all areas that were indexed and surveyed, Sri Lanka’s highest rank was in our GDP/unit of energy use, where we scored an astounding 2nd rank globally. This is a remarkable achievement for our island nation, given our overall global ranking.
While this indicates that Sri Lanka has a lot more work to do to improve our innovation index, there are definitely positives we as Sri Lankans can take away from this report. Our ability to identify our weaknesses and to find solutions that bring about positive change to these areas will decide where we stack up in 2018 and beyond.

