৬ই জুন, ১৯৪৪
ইংলিশ চ্যানেল পাড়ি দিয়ে মিত্রবাহিনীর এক লাখের বেশি সেনা ফ্রান্সের উপকূলে নামে। নরম্যান্ডি ল্যান্ডিং নামে পরিচিত এই উভচর অপারেশনের মাধ্যমে জার্মানির আটলান্টিক মহাসাগর ঘেঁষা ডিফেন্স লাইন অতিক্রম করে মিত্রবাহিনী। তাদের বহরে ছিল উভচর সামরিক যান, এয়ার সাপোর্টসহ তখনকার সর্বাধুনিক অস্ত্র-শস্ত্র। কয়েক ডজন জেনারেল মিলে এই অপারেশনের পরিকল্পনা করেন। এই অপারেশনের পর ইউরোপে নাৎসি জার্মানি আর ঘুরে দাঁড়াতে পারেনি।

২৩শে মার্চ, ১৯৪৫
ইউরোপের দীর্ঘতম নদী রাইন পাড়ি দিয়ে নাৎসি বাহিনীর উপর হামলা শুরু করেন জেনারেল মন্টেগোমারি। এই নদীই ফ্রান্স ও সুইজারল্যান্ডের সাথে জার্মানির সীমানা। ব্রিটিশদের ২১ আর্মি গ্রুপ আধুনিক সব উভচর অস্ত্র-সরঞ্জাম নিয়ে রাইন নদী পার হতে শুরু করে। প্রচণ্ড ফায়ার পাওয়ার এবং মিত্রদের সহায়তায় ২১ আর্মি গ্রুপ নদী তীরবর্তী নাৎসি পজিশনগুলো গুড়িয়ে দেয়। নাৎসি বাহিনীকে চেপে ধরে জার্মানির একের পর এক শহর দখল করে রাজধানী বার্লিনের দিকে ছড়িয়ে যায় তারা। অপারেশন প্লান্ডার নামের এই অপারেশন নাৎসিদের পতন তরান্বিত করে।
১১ই অক্টোবর, ১৯৭১
৫-৬ কিলোমিটার চওড়া খরস্রোতা ব্রহ্মপুত্র নদ পাড়ি দিচ্ছে ৬০টি ইঞ্জিনবিহীন কাঠের নৌকা। তাদের লক্ষ্য ব্রহ্মপুত্রের পার সংলগ্ন কুড়িগ্রাম জেলার চিলমারী। চিলমারী বন্দরসহ ৬-৭টি এলাকায় শক্ত পজিশন নিয়েছে পাকিস্তান সেনাবাহিনী। গানবোট দিয়ে নদীতে নিয়মিত টহলও দিচ্ছে।
সবচেয়ে ভয়াবহ বিষয়- এখান থেকে তারা পূর্ব দিকে রৌমারীতে গানবোট নিয়ে হানা দিচ্ছে। রৌমারী ‘মুক্তাঞ্চল’ নামে পরিচিত। এপ্রিল থেকেই মুক্তিবাহিনী এখানে শত্রু মুক্ত অবস্থায় নিজেদের কর্তৃত্ব বজায় রাখছে, প্রশাসনও প্রতিষ্ঠা করেছে। কুড়িগ্রাম জেলার মূল ভূখণ্ড থেকে ব্রহ্মপুত্র নদের কারণে বিচ্ছিন্ন থাকায় পাকিস্তানি হানাদার বাহিনী বারবার চেষ্টা করেও রৌমারীর মাটিতে পা দিতে পারেনি। অন্যদিকগুলো ছিল ভারত গিয়ে ঘেরা। কিন্তু বড় হামলা হলে পতন হতে পারে রৌমারীর।
বন্দর, রেল স্টেশন আর সড়ক যোগাযোগের জন্য চিলমারী ছিল কৌশলগতভাবে গুরুত্বপূর্ণ স্থান। এখান থেকেই রৌমারীতে হানা দিত পাকিস্তানিরা। ফলে রৌমারীকে রক্ষা করার একমাত্র উপায় চিলমারীতে অতর্কিত হামলা বা রেইড (Raid) করে পাক বাহিনীর মেরুদণ্ড ভেঙ্গে দেওয়া। রেইড অপারেশনের লক্ষ্য থাকে শত্রু এলাকায় প্রবেশ করা এবং সেখানে হামলা চালিয়ে আবার নিজেদের এলাকায় ফেরত আসা। রেইডের লক্ষ্য ভূমি দখল করা নয়। নৌকায় চেপে পাক বাহিনীকে গুড়িয়ে দিতে ছুটেছে একদল সেনা। পাকবাহিনীর গানবোটের মুখোমুখি হলে সাক্ষাৎ মৃত্যু। তার উপর এভাবে খোলা নৌকায় নদী পাড়ি দেওয়াটাই ভয়াবহ বিপজ্জনক কাজ। প্রশ্ন যখন দেশের স্বাধীনতার তখন ঝুঁকি তো নিতেই হবে। আর ঝুঁকি নেয়াটা সফলও হলো। অক্টোবরের ১১ তারিখ একযোগে সবগুলো পাকিস্তানি অবস্থানে হামলা শুরু হলো।
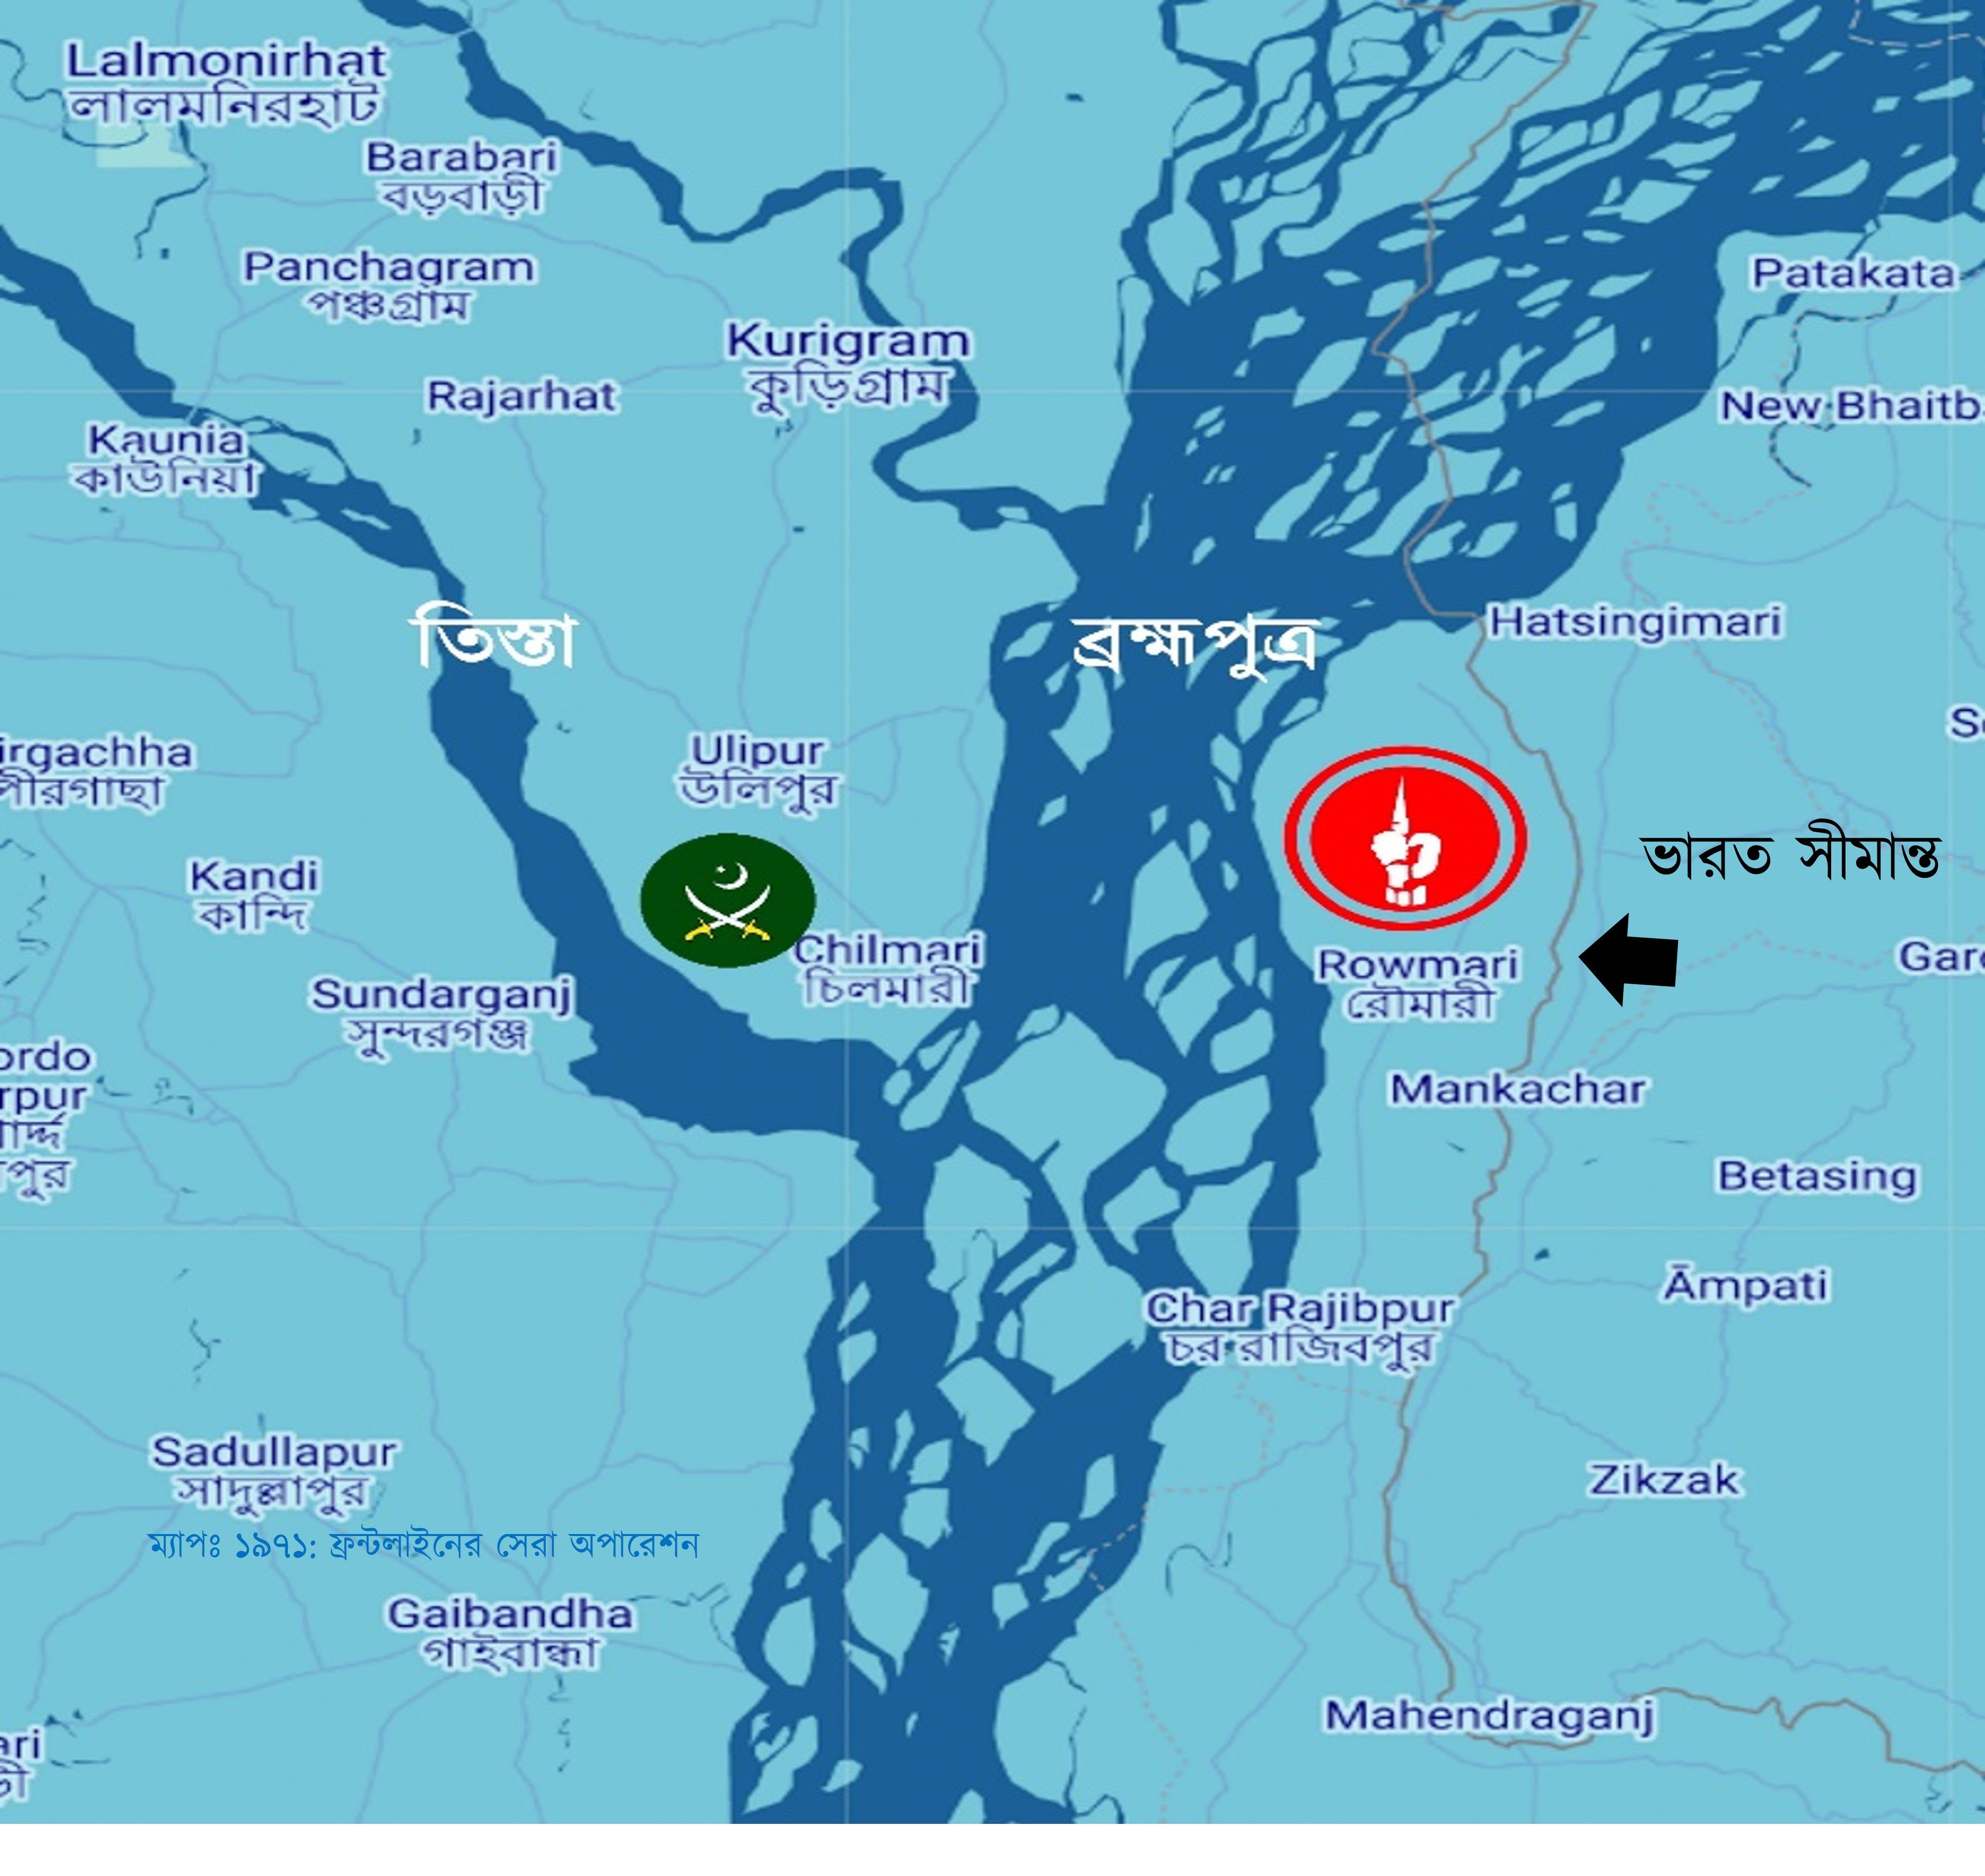
স্বাধীনতাযুদ্ধের সময় ১১ নম্বর সেক্টরের অন্তর্গত কুড়িগ্রামের রৌমারী ছিল মুক্তিবাহিনীর দুর্ভেদ্য ঘাঁটি এবং প্রশিক্ষণকেন্দ্র। যুদ্ধের সময় শতশত যোদ্ধা এখানে প্রশিক্ষণ নেয়। ১৫ দিনের প্রশিক্ষিত যোদ্ধাদের মাত্র ২৫% এর হাতে অস্ত্র দেওয়া সম্ভব হয়েছে। খাদ্য ও অস্ত্রের সংকট প্রবল। তবে এত স্বল্পতার মধ্যেও সাহসের কমতি নেই। এরা সবাই সেক্টর কমান্ডারের ‘Private Army’ (সৈনিকদের প্রথম পদবি ‘private’ এর নাম অনুযায়ী) নামে পরিচিত।
ব্রহ্মপুত্র সংলগ্ন এই অঞ্চলে অন্য এলাকার মতো গেরিলা কায়দায় যুদ্ধ চলছে না। প্রতিদিনই গোলাগুলি হচ্ছে। নদীর মাঝের চরগুলো (ক্ষুদ্র দ্বীপ) কখনও পাকবাহিনীর দখলে যাচ্ছে আবার কখনও যাচ্ছে মুক্তিবাহিনীর দখলে। দাবা খেলার মতো আগ-পিছ হচ্ছে।
চরগুলোতে প্রায়ই মুক্তি এবং পাক বাহিনীর Fighting petrol party (মূল প্রতিরক্ষার একটু সামনে বা শত্রর নিয়ন্ত্রিত এলাকার কাছে যেয়ে টহল দেয় যে দল, শত্রু অগ্রসর হলে এরা মূল বাহিনীকে জানাতে পারে। প্রয়োজনে ফায়ার করে শত্রুর গতিকেও সাময়িকভাবে কমিয়ে দিতে পারে) গুলোর মধ্যে সংঘর্ষ হতো।
যেমন কিছুদিন আগে কোদালকাঠি চরটি পাক বাহিনীর দখলে ছিল। সেপ্টেম্বরের প্রথম দিকে সুবেদার আফতাব (বীর উত্তম) ২ কোম্পানি সৈন্য নিয়ে পাক বাহিনীর ঘাঁটির কাছে ট্রেঞ্চ খুঁড়ে অবস্থান নেন। মুক্তিযোদ্ধাদের উপস্থিতি টের পেয়ে পাকিস্তানিরা আক্রমণ চালায় আর খোলা জায়গায় পেয়ে শত্রুদের উপর ফায়ার করে মুক্তিবাহিনী। সকালে পাক বাহিনীর পর পর তিনবার মুক্তিবাহিনীর লাইনের দিকে আক্রমণ করে এবং প্রত্যেক বারই পরাস্ত হয়। অবশিষ্টরা গানবোটে করে পালিয়ে যায়।
রৌমারী দখল না করতে পারলেও পাকবাহিনী ছোট ছোট হামলা করে মুক্তিবাহিনীকে অনেক চাপে রাখছিল। কোনোভাবে পাকবাহিনী বড় আঘাত হানলে বিপর্যয় নামতে পারে।
১১ নং সেক্টরের দায়িত্বে প্রথমে ছিল মেজর জিয়াউর রহমান (পরে মেজর জেনারেল এবং বীর উত্তম)। তার পরে দায়িত্ব নেন মেজর আবু তাহের (পরে কর্নেল এবং বীর উত্তম)। দায়িত্ব নিয়েই তিনি রৌমারীর প্রতিরক্ষার জন্য পরিকল্পনা করতে শুরু করেন। সমাধান একটাই- শত্রু আঘাত হানার আগে তার উপর হামলা করে শত্রুর কোমর ভেঙে দিতে হবে। শুরু হয় চিলমারীতে হামলার পরিকল্পনা।
চিলমারীতে পাকিস্তানি বাহিনীর শক্তিমত্তা এবং বিন্যাস:
- বন্দরে ৩২ বালুচ রেজিমেন্ট দুই কোম্পানি।
- চিলমারীর ওয়াপদা ভবন, জোরগাছ, রাজভিটা, থানাহাট পুলিশ স্টেশন, বলবাড়ি রেলওয়ে স্টেশন এবং পুলিশ স্টেশন মিলে আরো ২ কোম্পানি মিলিশিয়া, রাজাকার, সিভিল আর্মড ফোর্সেস (সিএএফ)।
আশেপাশের সব অবস্থান মিলে পাক সেনার সংখ্যা এক ব্যাটালিয়ন।
ওয়ারেন্ট অফিসার শফিকউল্লাহ গোয়েন্দা তথ্য, ম্যাপ আঁকা, নদীর জোয়ার ভাটা, পাক গানবোটের টহল ইত্যাদি বিষয়ে খোঁজে খবর নেন। সাব-সেক্টর কমান্ডার স্কোয়াড্রন লিডার হামিদুল্লাহ খান, সুবেদার আফতাব, কম্যান্ডার চাদসহ সবাইকে নিয়ে সার্বিক পরিকল্পনা করেন মেজর তাহের।
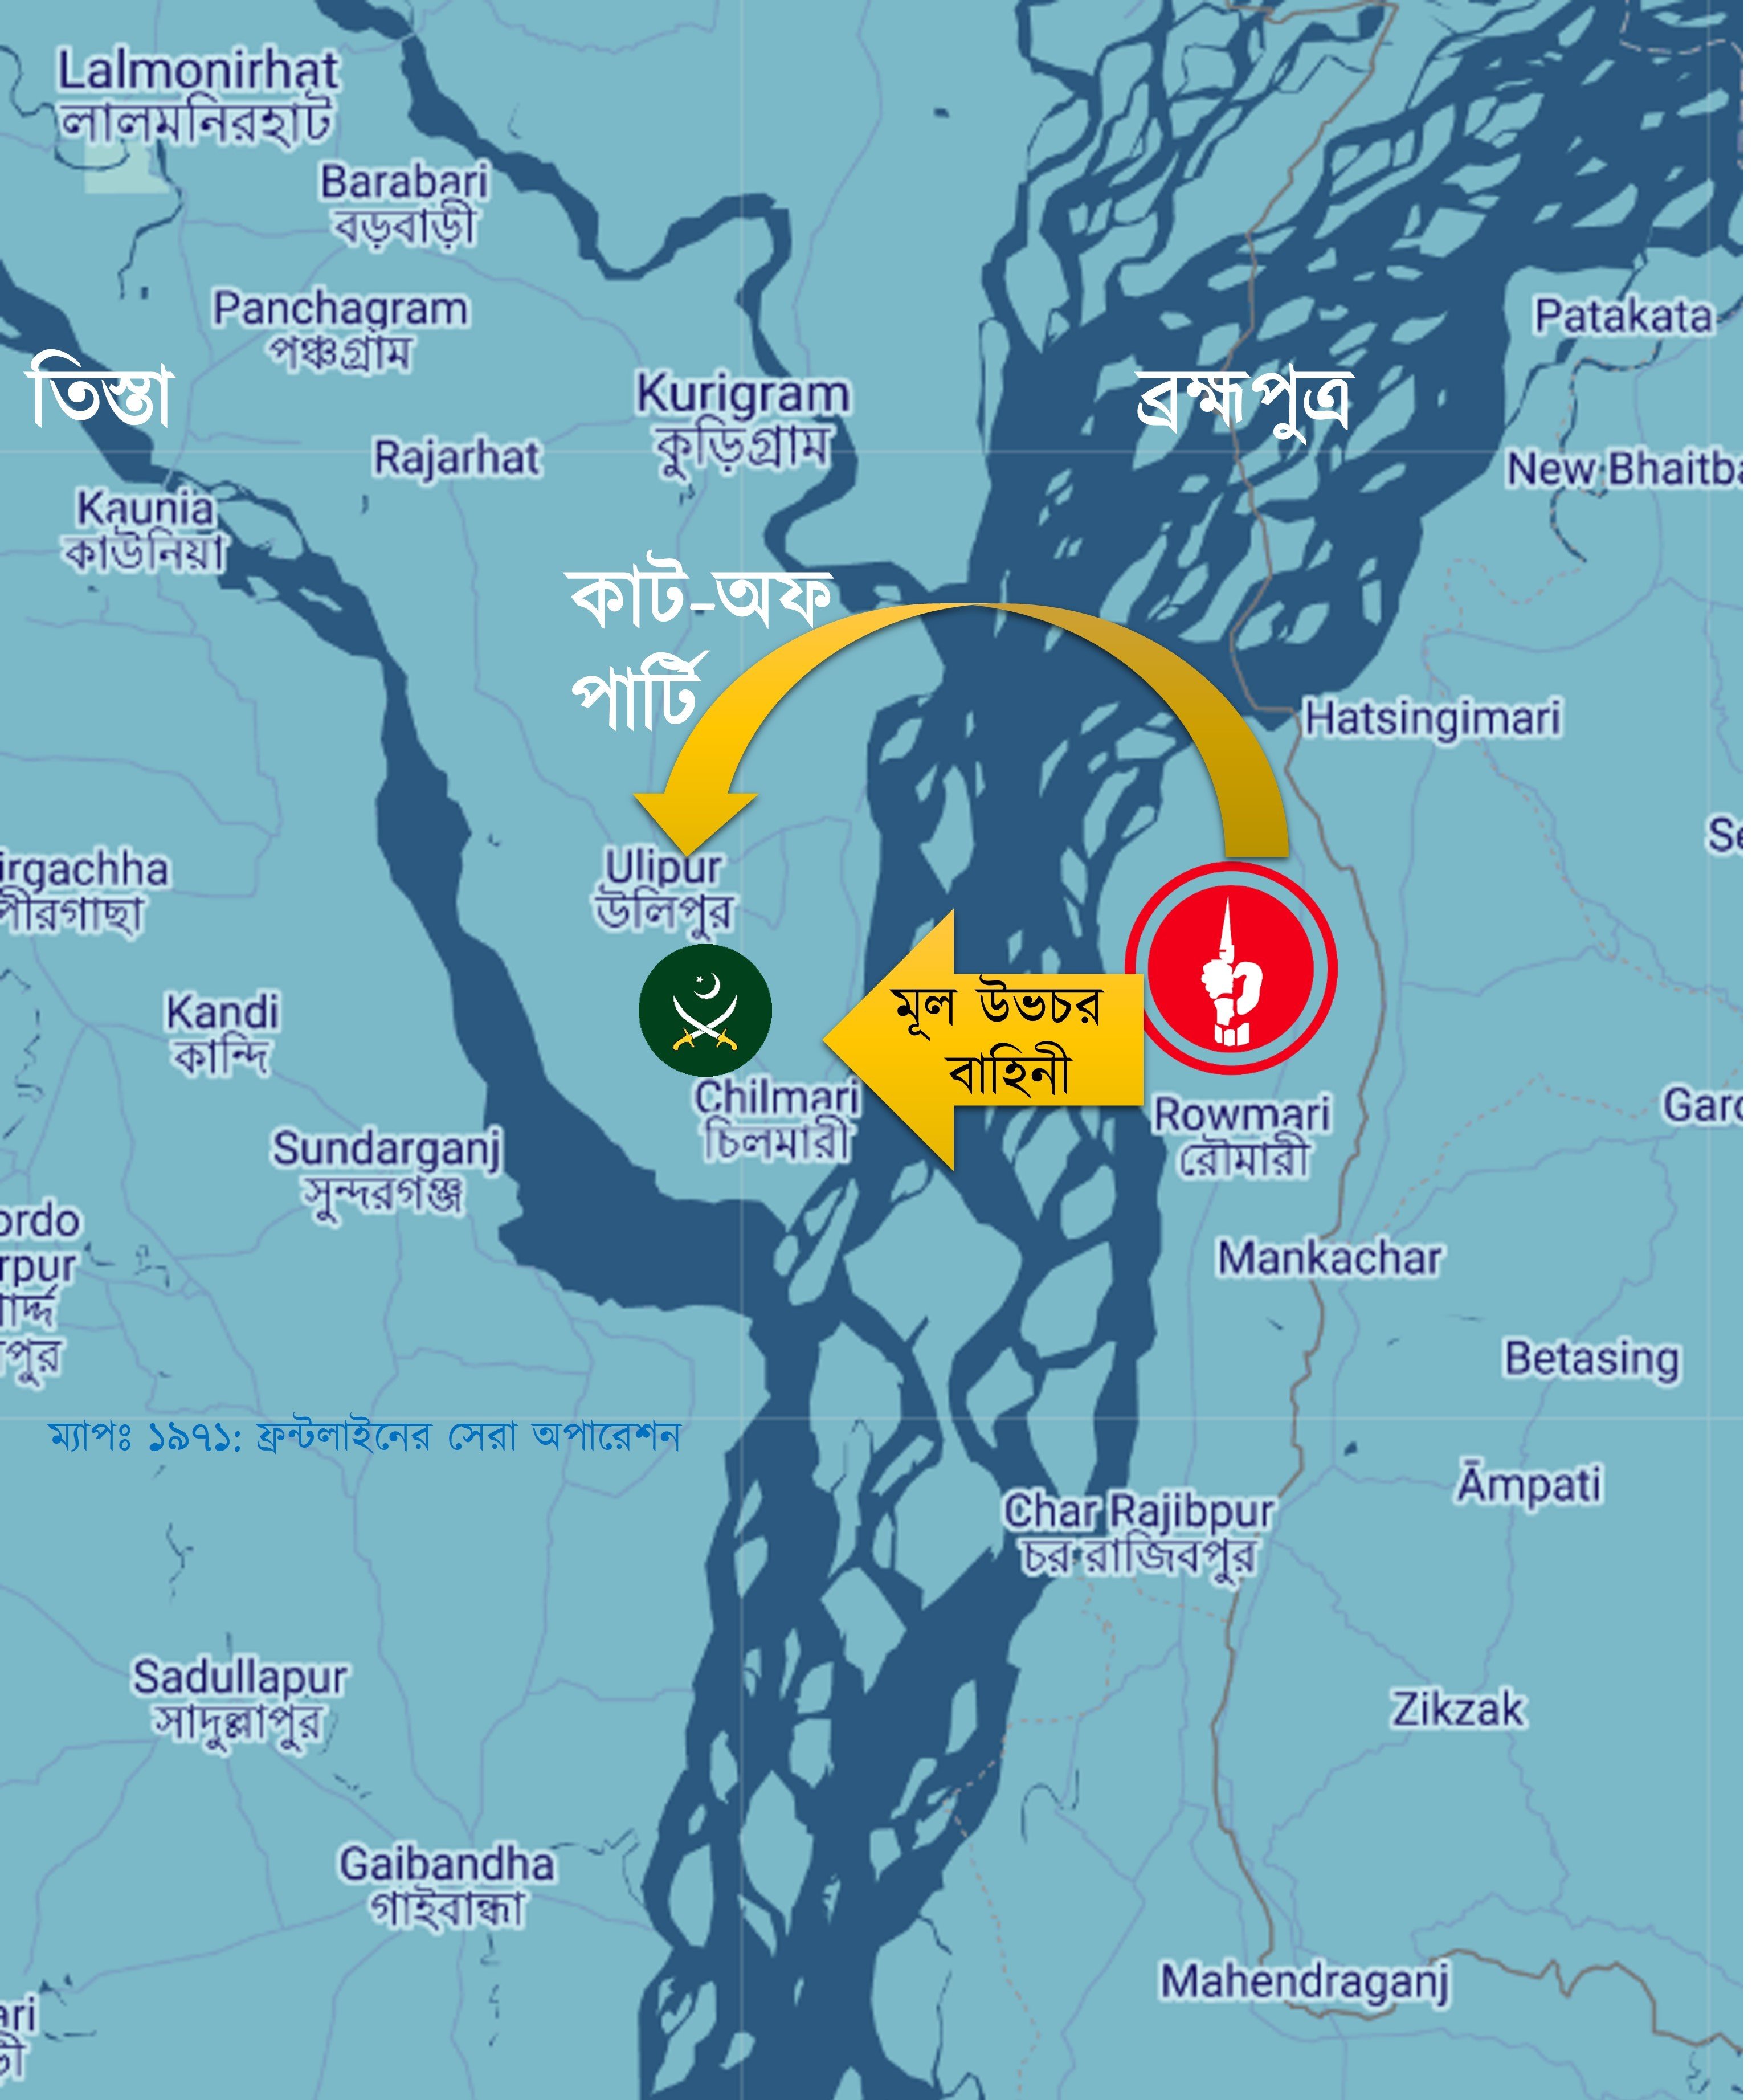
৯ই অক্টোবর চিলমারীর পাশে উলিপুরে মুক্তিবাহিনীর একটি cut off party (আক্রমণ শুরু হলে নতুন করে সাহায্য বা Reinforcement যেন আসতে না পারে সেটা নিশ্চিত করে এই দল) গোপনে অবস্থান নেয়।
১১ তারিখ ৬০টি নৌকায় মুক্তিবাহিনীর সেনাদের সাথে নদীর এক চরে ৪টি Field Gun বা কামান টেনে আনা হয়। চালিয়াপাড়ায় (ছালিপাড়া) বালুর উপর নামানোর সময় বার বার কামান দেবে যাচ্ছিল। পাশাপাশি কয়েকটা নৌকা রেখে একটা থেকে আরেকটা নৌকায় কামান নিয়ে শক্ত কাদামাটি পার করা হয়। কামানগুলো ফায়ার সাপোর্ট দেবে।
নায়েব সুবেদার আব্দুল মান্নানের (বীর প্রতীক) দল আক্রমণ করবে ওয়াপদা কলোনি। কমান্ডার আবুল কাশেম চাদের নেতৃত্বে ছোট ছোট কয়েকটা দল গোরগাছা, রাজভিটা, থানাহাট পুলিশ স্টেশন এবং ব্রিজের অবস্থানে আক্রমণ করবে। মূল বাহিনী ৬ ভাগে ভাগ হয়ে বিভিন্ন পজিশনে হামলা চালাবে। ভোর ৪টায় একযোগে সব পজিশনে হামলা শুরু করে মুক্তিবাহিনী।
এদিকে পুলিশ স্টেশনে আবুল কাশেম চাদ এবং ২ জন মুক্তিযোদ্ধা ছাড়া আর কেউ সময়মত পৌঁছাতে পারেনি। ইতোমধ্যে অন্য স্থানগুলোতে গোলাগুলি শুরু হয়। গুলির শব্দে থানার দারোগা বের হয়ে আসেন। আবুল কাশেম মুখে প্রচণ্ড সাহস এবং আত্মবিশ্বাস নিয়ে দারোগার কাছাকাছি গিয়ে বলেন, “মুক্তিবাহিনী থানা ঘিরে ফেলেছে। আত্মসমর্পণ করতে রাজি হন।” কোনো গুলি খরচ ছাড়াই কৌশলে সাড়ে ৪টার মধ্যেই থানায় উপস্থিত ৬০-৮০ জন মিলিশিয়া আত্মসমর্পণ করে।
ওয়াপদা ভবনে রকেট লাঞ্চার দিয়ে আঘাত হানা হয়। সকাল ৬টার মধ্যে রাজারভিটা, জোরগাছ ও পুলিশ স্টেশন দখল করে নেয় মুক্তিবাহিনী। ৭০ জনের আত্মসমর্পণের মধ্য দিয়ে পতন হয় রাজারভিটা মাদ্রাসা ক্যাম্পের। ফিল্ড-গানগুলোও এ সময় গোলা নিক্ষেপ করছিল।
সাধারণত এত বড় অভিযানে কম্যান্ডার যুদ্ধক্ষেত্রের একটু পেছনে থাকলেও যুদ্ধের একপর্যায়ে মেজর তাহের নিজেই যুদ্ধক্ষেত্রে প্রবেশ করেন। গোলাগুলি মধ্যেই পাক মর্টারে আহত এক নারীকে তার দল escort (পাহারা) করে হাসপাতালে নিয়ে যান। এছাড়াও পাক ঘাঁটি থেকে জব্দ করা খাবারও তিনি গ্রামবাসীকে বিলিয়ে দেন।
তবে বালাবাড়ি স্টেশনে কয়েক দফা সংঘর্ষের পর পিছু হটতে বাধ্য হয় মুক্তিবাহিনী। মেজর তাহের এখানে গোলাবর্ষণ করতে ওয়্যারলেসে নির্দেশ দেন। কিন্তু দুর্ভাগ্যজনকভাবে রেল স্টেশন মুক্তিবাহিনীর কামানের রেঞ্জের বাইরে ছিল। বাকি সবগুলো পজিশনে মুক্তিবাহিনী সুবিধাজনক অবস্থান ছিল। পাকবাহিনীর প্রচুর ক্ষয়ক্ষতি হলে তারা বাংকারের ভেতরে অবস্থান নিয়ে প্রতিরক্ষামূলক অবস্থানে যায়।
মেজর তাহের দখল করা প্রায় সব অস্ত্র ও গোলাবারুদ গাজীর চর হয়ে রৌমারী পাঠিয়ে দেবার নির্দেশ দেন। Rear Party (অন্যদলগুলো যখন হামলা করে ফেরত আসবে তখন শত্রু যেন পিছু না নিয়ে হামলা না করে বসে সেটা নিশ্চিত করে এই দল) ছাড়া বাকি দলগুলো আস্তে আস্তে ফেরত যেতে শুরু করে।
এই অপারেশনের লক্ষ্য ছিল পাকবাহিনীর ক্ষতি করা, ভূমি দখল নয়। ১৩ই অক্টোবর চিলমারীর সব পাক ঘাঁটি তছনছ করে মেজর তাহের বিপুল সংখ্যক যুদ্ধবন্দী (prisoner of war), জব্দ করা অস্ত্র-গোলাবারুদ নিয়ে রৌমারীতে নিরাপদে ফেরত আসেন। পাক বাহিনীর ৩২ বেলুচ রেজিমেন্টের মেরুদণ্ড ভেঙ্গে দেয় মাত্র ১৫দিনের ট্রেনিং পাওয়া মুক্তিসেনারা।
চিলমারী রেইড ছিল একটি অত্যন্ত পরিকল্পিত যুদ্ধ। আলাদাভাবে মুক্তিবাহিনী প্রতিটি ক্ষেত্রে (যেমন: অস্ত্র, প্রশিক্ষণ, পরিবহন ইত্যাদি) পিছিয়ে ছিল। কিন্তু দারুণ পরিকল্পনা দিয়ে মুক্তিবাহিনীর ক্ষুদ্র ক্ষুদ্র শক্তিগুলো এক হয়ে কাজ করে, সবাই নিজের দায়িত্বটা ঠিকমত পালন করেন। মুক্তিবাহিনীর element of surprise বা আকস্মিকতায় পাকবাহিনী হতভম্ব হয়ে যায়। তাদের ধারণাতেই ছিল না অস্ত্র এবং প্রশিক্ষণে শতগুণ পিছিয়ে থাকা মুক্তিবাহিনী বিশাল ব্রহ্মপুত্র পাড়ি দিয়ে এত বড় River crossing raid দিতে পারে। এছাড়াও দেশি নৌকায় এভাবে কামান টেনে আনার ইতিহাস বিরল। রেকি করা থেকে শুরু করে প্রতিকূল নদী পার হওয়া, সাধারণ মানুষের নৌকা জোগাড় করে দেওয়া, পথ দেখানোতে একধরনের স্বতঃস্ফূর্ততা দেখা যায়। জনগণ বুঝিয়ে দেয় হাতে অস্ত্র না থাকলেও তারা এক একজন যোদ্ধা ।
কর্নেল তাহেরসহ অনেক সামরিক বিশেষজ্ঞ একে মিত্রবাহিনীর ইংলিশ চ্যানেল পাড়ি দেওয়ার সাথে তুলনা করেন।


.jpeg?w=600)

