Hakiem Hanif
If someone were to compile a list of often used economic terms, ‘GDP’ will definitely come out on top. It’s also the only real celebrity among economic indicators. From politicians to news anchors, pretty much everyone fawns over it. But what’s the noise all about?
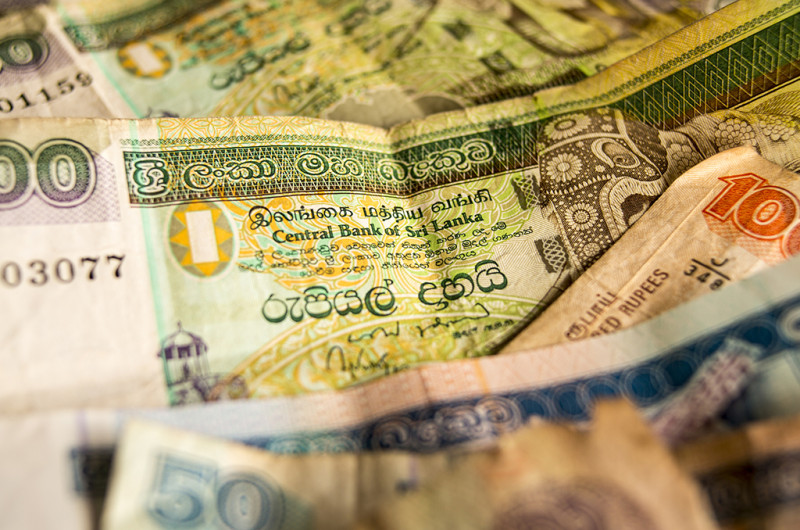
To begin with, GDP stands for Gross Domestic Product. It is defined as a measure of economic activity which captures the value of goods and services produced by a country during a given period. Simply put, it is the yardstick by which an economy is normally measured.
While GDP to most people might just be a number, there’s quite a lot of work which goes into it. Just so you know, the calculation of GDP itself is based on a framework called the System of National Accounts or SNA, to which the entire world has agreed to.
Sri Lanka’s GDP By The Numbers
According to the most recent data available for a full year, Sri Lanka’s GDP currently stands at USD 75 billion1. This is what it looks like in comparison to other regional, lower middle income economies.
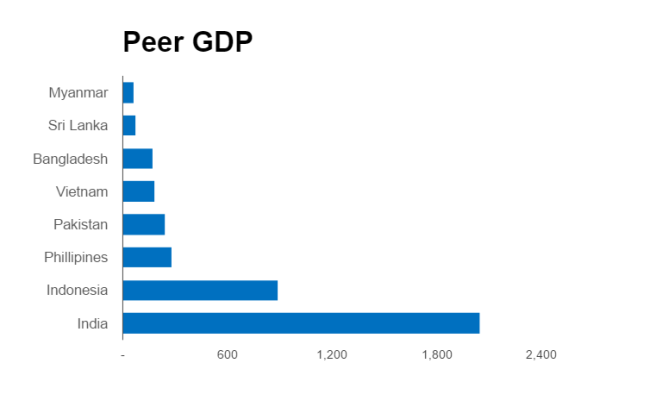
Peer GDP Chart
Something worth noticing in that chart is how close Myanmar is to catching up with us. Unless you haven’t heard already, Myanmar is a country whose economy is just starting to open up. Also notice how Vietnam has soared way past us, mainly because they’ve had the foresight to adopt sound economic policies which have made the country extremely favourable for business.
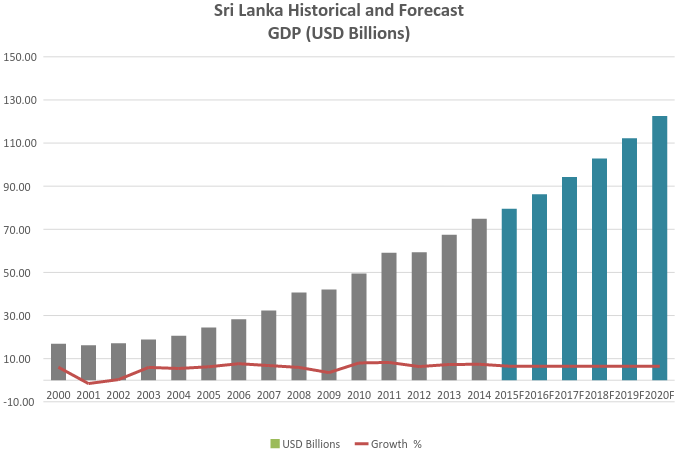
Sri Lanka Historical and Forecast GDP
Now that we know where we stand in terms of the size of our economy, let’s have a look how our GDP has grown since the beginning of the century. The bars shaded in gray depict our historical GDP figures. Growth has been mostly okay(ish), except for the occasional dip.
Next, focus your attention to the columns shaded in blue. Those columns represent forecasts made by the IMF on the Sri Lankan economy. The IMF staff expect our economy to grow at around 6.5% per year over the next 4 to 5 years. They also expect our GDP to reach USD 122 billion by the end of that period. The World Bank too, expects our economy to grow by around 6% per annum over the next few years.
As you might well be thinking right now, the numbers sure do look good. But does this mean that we are all set for the future? Not really. Remember that these are all forecasts which were made based on present economic conditions. In reality, there’s quite a lot of work that needs to be done if we are to achieve the sort of growth depicted above.
Dissecting The GDP
Is that all there is to the GDP? Absolutely not.
Now, let’s take a look at how each sector of the economy contributes to the economic pie. Just to be clear, we are not going to talk about Year-on-Year growth. Instead, we’ll be talking about the contribution made by each sector of the economy towards the country’s overall GDP.
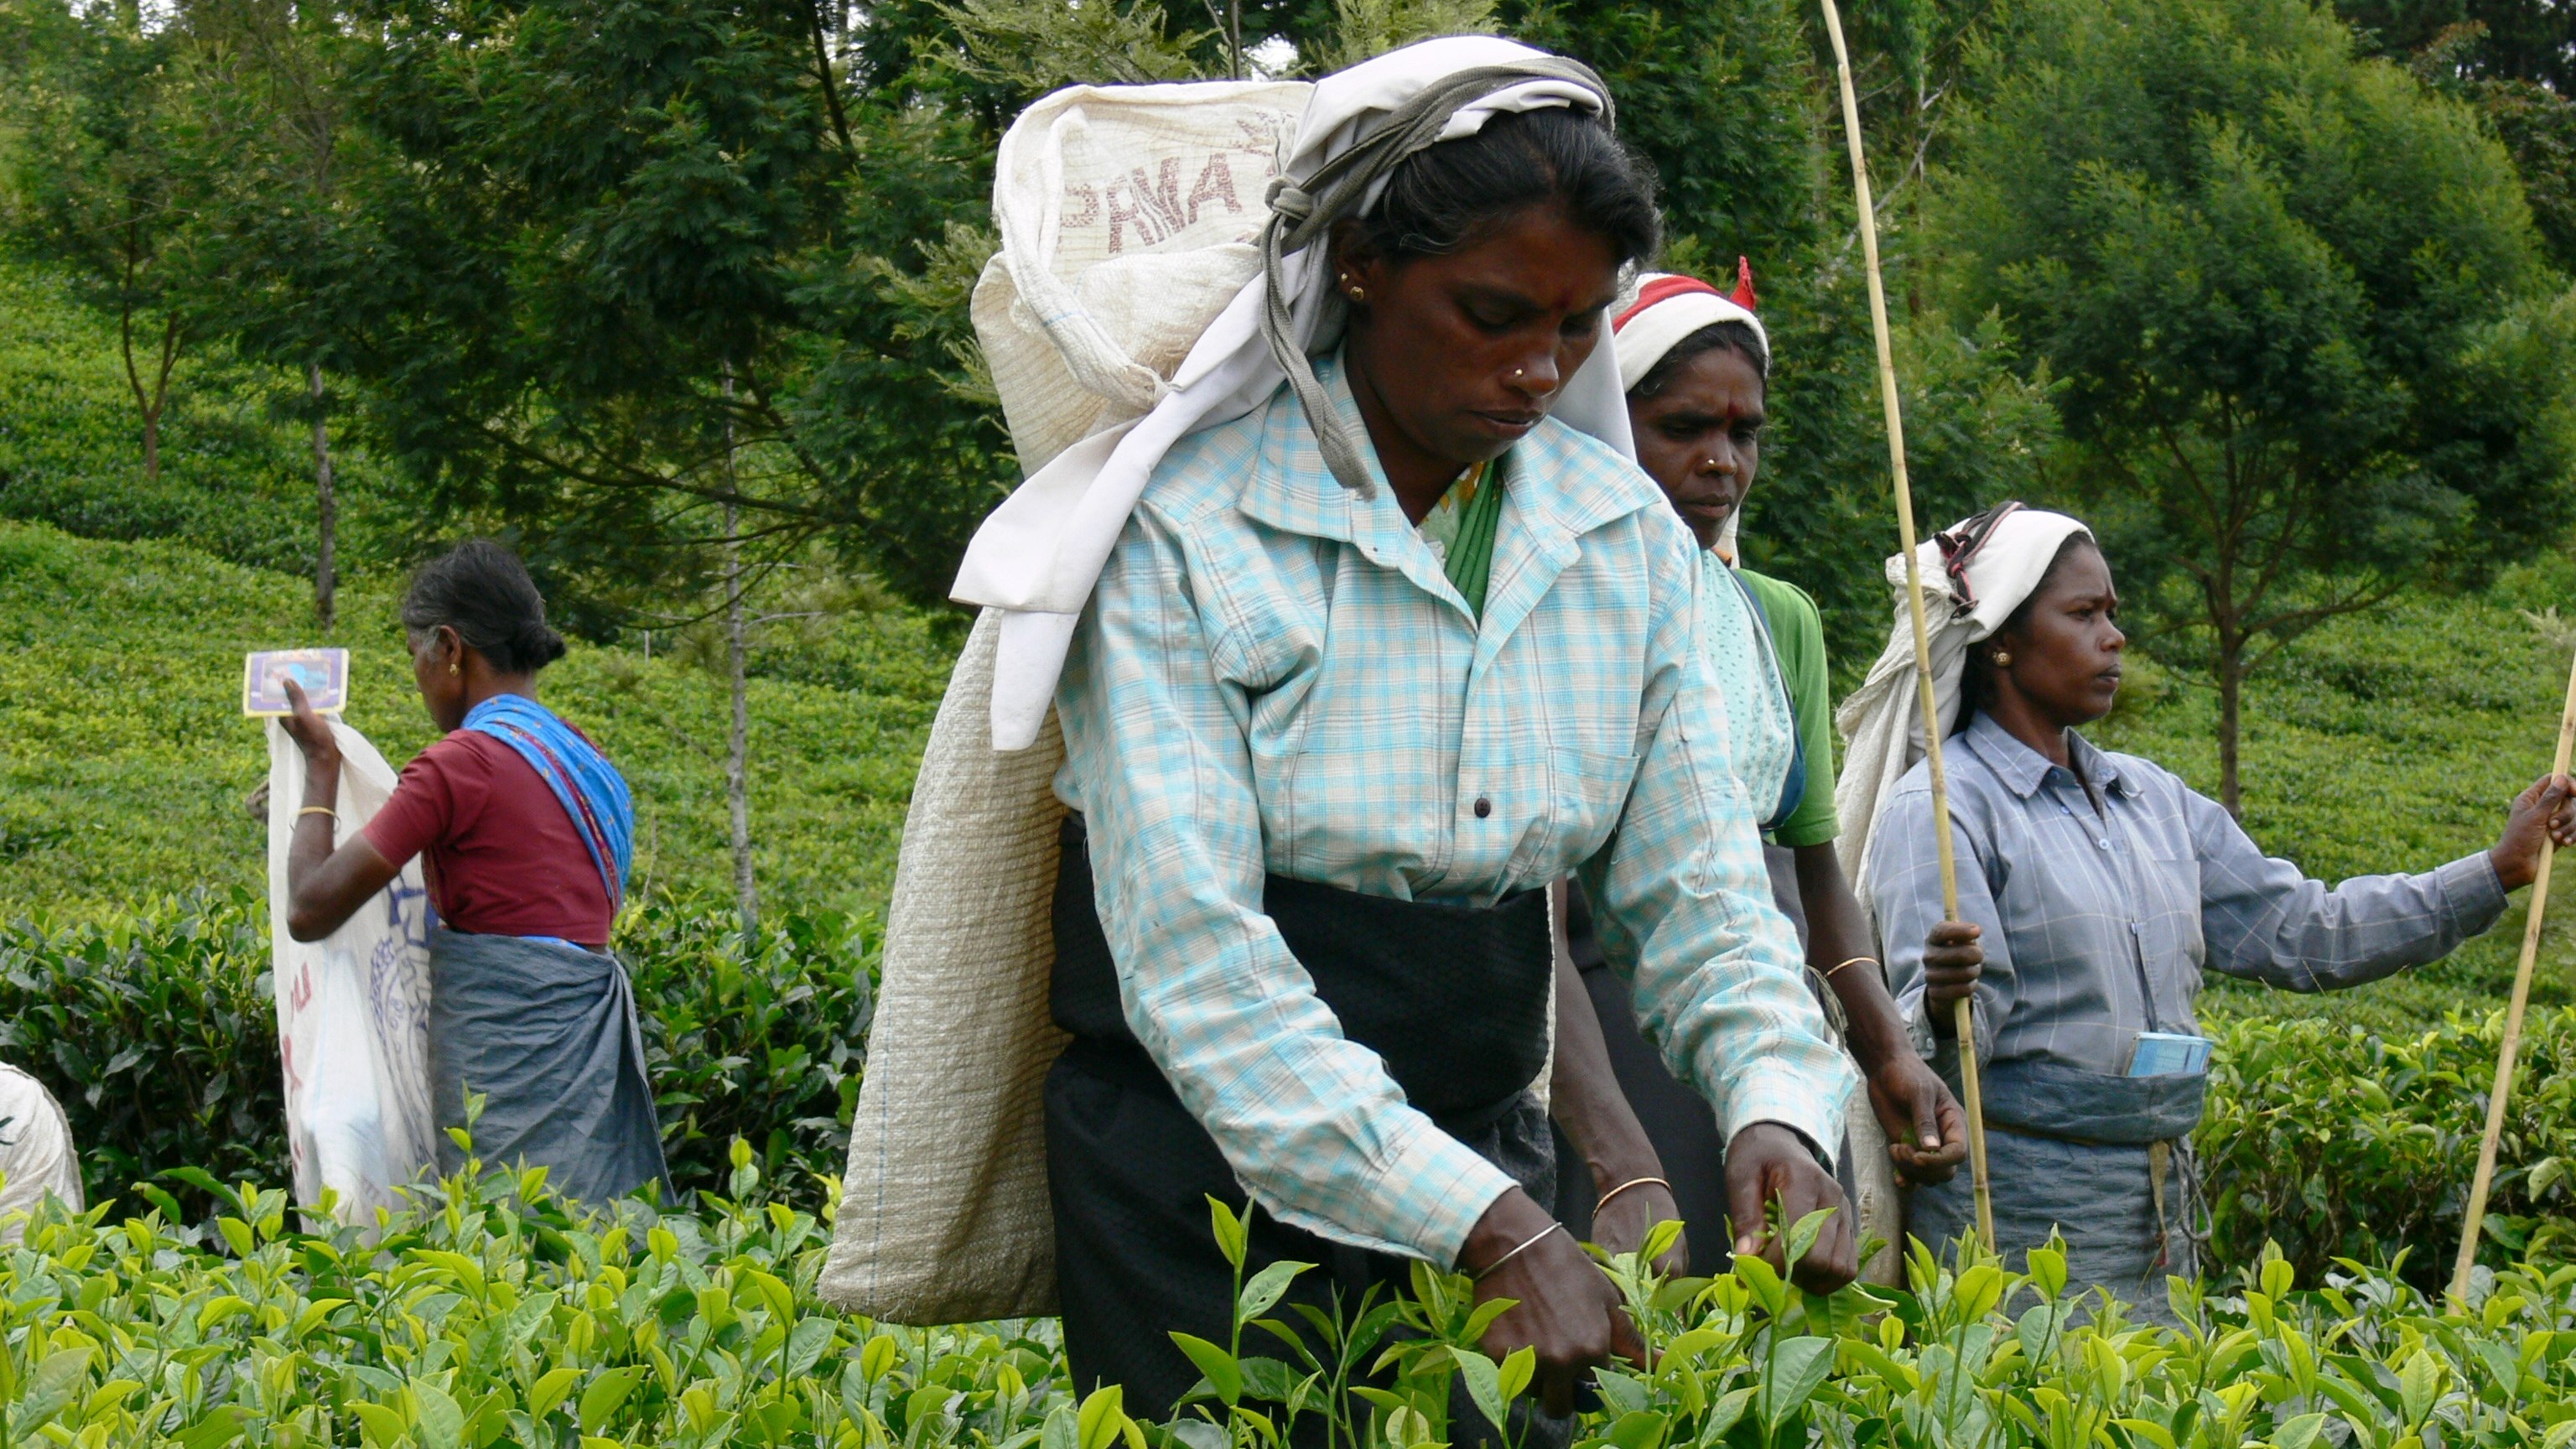
Normally, the Central Bank of Sri Lanka breaks down the country’s total GDP into three parts, each representing a different sector of the economy. And the three sectors are *drum roll* : Agriculture, Industry and Services2.
It doesn’t end there. Each of those three sectors can be broken down into smaller sub-sectors. For instance, the Agricultural sector can be broken down into Agriculture, Livestock and Forestry, and Fishing. Similarly, the Industrial sector can be broken down into Mining and Quarrying, Manufacturing, Electricity, Gas and Water, and Construction. The Service sector can also be broken down along similar lines.
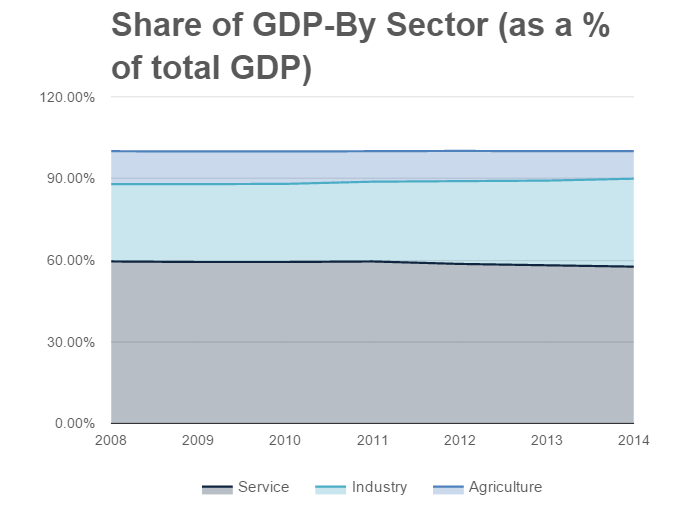
Share of GDP by Sector
Look at the chart above and right off the bat, you’ll notice that the Service sector is by far the largest contributor to the GDP, followed by the Industrial sector and the Agricultural sector. Look even more closely and you’ll notice that the Industrial sector’s share of the GDP has slowly increased over the last couple of years.
The Agricultural sector though, has been contributing relatively less and less to the GDP for quite some time now. Why? Well, one major reason is that our agricultural exports are mostly commoditised, which means they fetch lower prices in the global market. Another reason is that the local agricultural sector has a relatively higher cost structure compared to other competing economies, and with global commodity prices having sunk to historic lows, it’s pretty clear why the sector hasn’t been doing so well.
On a side note, the Fisheries sector has actually shown some marginal growth since 2008, according to the data released by the Central Bank.
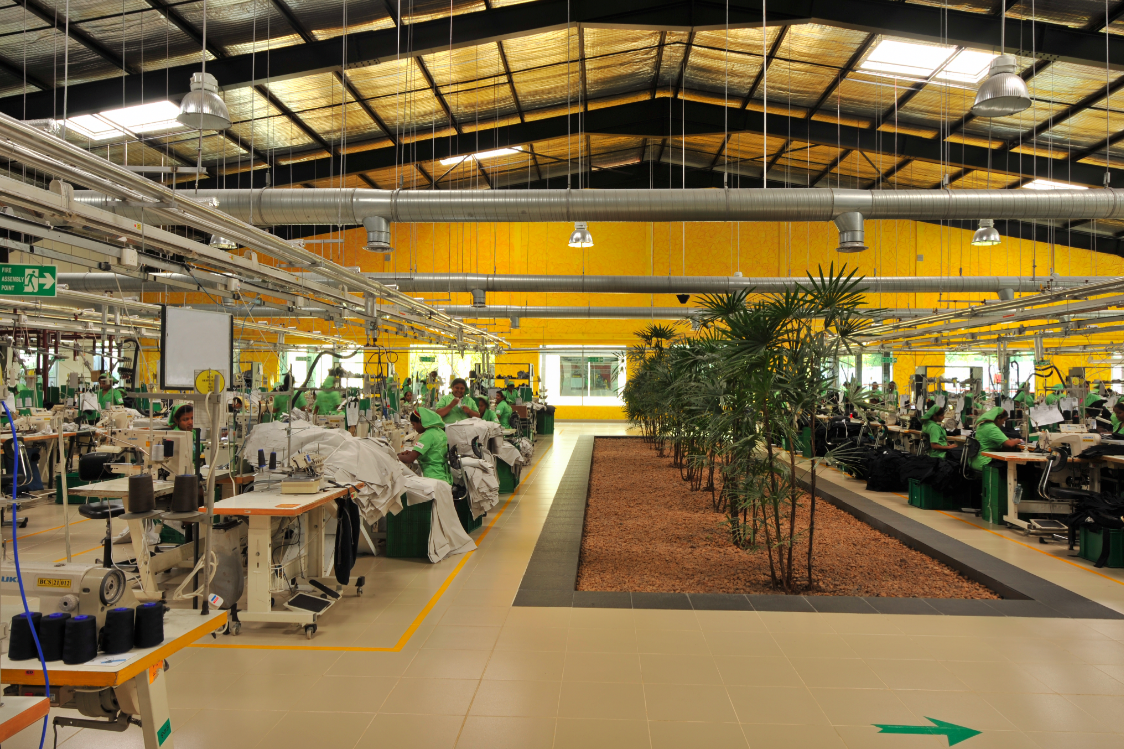
Okay, enough with the Agri talk. Let’s now shine a light on the Industrial sector, which is the second largest contributor toward Sri Lanka’s GDP.
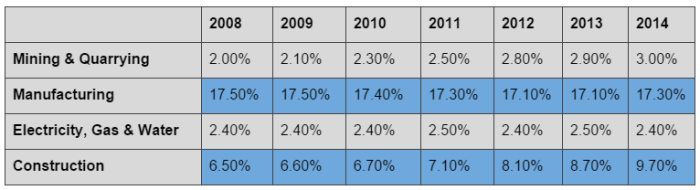
Contribution of each sub-sector of the Industrial sector towards the GDP (as a percentage of total GDP)
As you can see above, breaking down the Industrial sector’s contribution towards the GDP reveals two very obvious things. One, Manufacturing is the largest sub-sector within the entire Industrial sector. Two, the Construction sub-sector has shown gradual growth since 2009. This can be attributed to the post war construction boom within the country.
Next up, the biggest contributor to our GDP: the Service Sector.
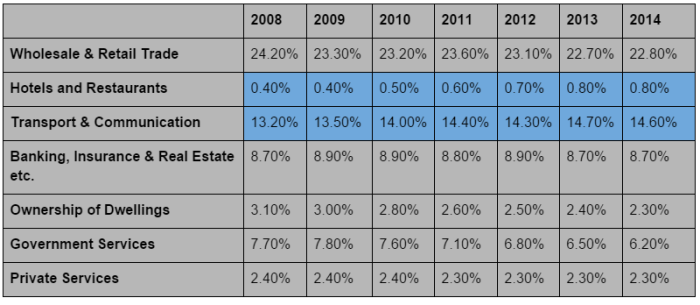
Contribution of each sub-sector of the Service sector towards the GDP (as a percentage of total GDP)
As is obviously visible, the breakout stars of the Service sector are the Transport and Communication sector, and the Hotels and Restaurants sector (highlighted in blue). Understandably, the end of the war was a huge boon to the H&T sector. Meanwhile, the Transport and Communication sector seems to have benefited from the continuing increase in mobile penetration, and the resultant increase in data consumption, at least according to the Central Bank.
But what about the “Transport” part, you may ask. Again, the domestic transport sector did benefit quite well from the end of the conflict. On the other hand, the contribution of the Cargo Handling sector (which falls under Transport) toward the island’s GDP has pretty much remained the same. This sector is something worth having your eyes on, especially given Sri Lanka’s proximity to a very important global shipping route, and also because it is of critical importance to global trade. Our economy stands to benefit tremendously by positioning itself as a global transshipment hub.
To recap, Sri Lanka’s GDP is basically driven by the Service Sector and to some extent, the Industrial Sector. At the same time, the Construction, Hotel, and Transport & Communication sectors are starting to contribute more and more towards the economic / GDP pie. Also, our economy is expected to grow at around 6% to 6.5% per annum over the next few years.
P.S. If you have the time to spare, you should definitely go through the entirety of the Central Bank’s Annual report. It’s totally worth it.
1 Statistics in current market prices.
2 CBSL has stated their intention to change the sectoral classification in line with international guidelines.
Cover image credit: hapag-lloyd.de/